
Anton Schuurman
In an earlier Blog Joost Jongerden wrote about Hofstee’s Cartophoot[i]. In this blog I will write something about the actual map that can be seen on top of the cartophoot or Hofstee’s puzzle, as it was called, in the ground floor of the Leeuwenborch-building. I will argue that the map tells a lot about rural sociology after the Second World War – its research interests and methodologies.
The use of the maps demonstrate Hofstee’s training as a human geographer, his aversion of the American sociology of the time (with its undifferentiated and ahistorical approach of society) and the use of the cartophoot to study change in time (in a period that the number of Dutch municipalities almost did not change: 1138 in the middle of the nineteenth century; 1121 in 1950. Nowadays, there are only 352 municipalities in the Netherlands. Luckily, we have GIS now.)
Hofstee was a man who was involved in debates both in general sociology and rural sociology and international as well as national. He is responsible for the fact that we have good basic demographic figures on municipal level in the Netherlands, especially for the period 1811-1850. Those statistics were not collected by the Dutch Bureau for Statistics (CBS), nor by its forerunners. Hofstee’s demographic work was important for the debate on overpopulation – as it was perceived after the Second World War in the Netherlands – as well as for his work on rural modernisation in the 1950s – which was the central topic in the rural sociology of the time. Hofstee was strongly interested in the decline of fertility. For the discussion on overpopulation it was important to determine whether the rise of fertility after the Second World War was a temporary rise or a rupture with the long-term development of declining fertility due to family planning. For the discussion on (rural) modernization, family planning could serve as an indicator of which regions had a population with a modern attitude. For Hofstee, a modern attitude meant that people had a positive attitude towards change.
With the map that can be seen on top of the cartophoot Hofstee shows the increase/decrease of the crude birth rate between the fifties and the thirties of the twentieth century in the Netherlands. He uses a lot of shadings. To understand this map it is important that you know that red means that the birth rate has increased, and blue that the birth rate has decreased.

When you know a little bit of the Netherlands, its history and its geography you will know that the Southern provinces (Noord-Brabant and Limburg) were overwhelming Roman Catholic. The Roman Catholic population in the Netherlands (like the Orthodox Protestants) was well known for its high birth rate. But this map appears to show something different. In the same period that the crude birth rate for the country as a whole did not change: it remained 21.2, we see roughly in a line from Zeeland to Groningen a lot of red – in other words an increase – and in Noord-Brabant and Limburg a decrease. What is going on here?
First, you have to realize this is a map about changes in time, not about levels. In 1956-1959 the fertility for married women between 15-45 is 172.1 births per 1000 married women in the Netherlands. In Brabant and Limburg it is respectively 212.8 and 193.5 – which were indeed the highest provincial figures at that time (with Overijssel). The lowest were for Groningen (146.1) and Noord- and Zuid-Holland (152.3 and 153.1). In 1931-1935 these numbers were 269.1 (Noord-Brabant), 243.3 (Limburg), 141.2 (Noord-Holland) and 151.4 (Zuid-Holland) (Hofstee 1962, 23). Thus, although fertility declined, it remained high in the South of the Netherlands.
Second, and even more interesting, you should realize that the map that is on top of the cartophoot is in fact the fourth map that Hofstee published in his well-known article The growth of the Dutch population (De groei van de Nederlandse bevolking) in 1962. The combination of the four maps provides another, better frame of how to read this map.
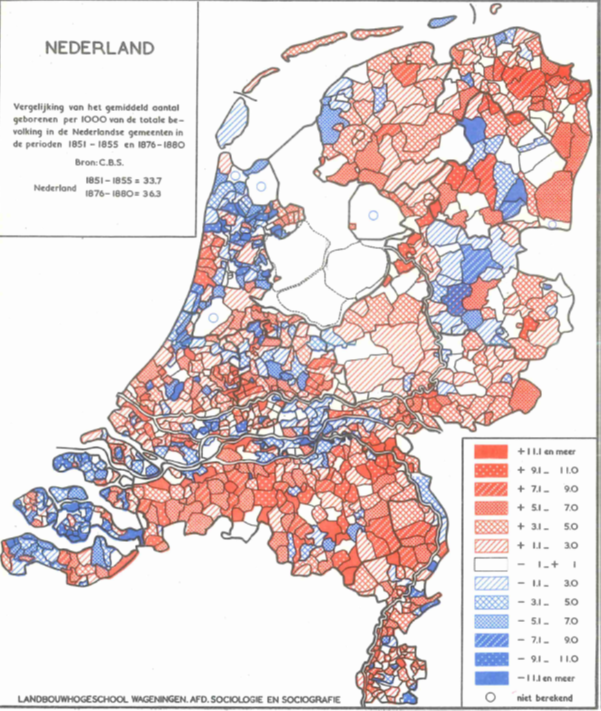
In the first map Hofstee compared the crude birth rate in 1876-1880 with the period 1851-1855. Thus, what has happened in the third quarter of the nineteenth century in the Netherlands? The crude birth rate of the Netherlands as such increased from 33.7 tot 36.3. At the municipal level in most of the provinces (except Zeeland and West-Friesland) red is the dominant colour. The populations was growing. This is the point of departure.
The second and third maps are the central maps. In the second map he compares the crude birth rates in the period1901-1905 with the period 1876-1880. What had happened in the last quarter of the nineteenth century? The Dutch crude birth rate declined from 36.3 per 1000 inhabitants to 31.8. But when you look at the map you see a kind of two Netherlands: the coastal provinces being blue, most of the inland provinces blue.

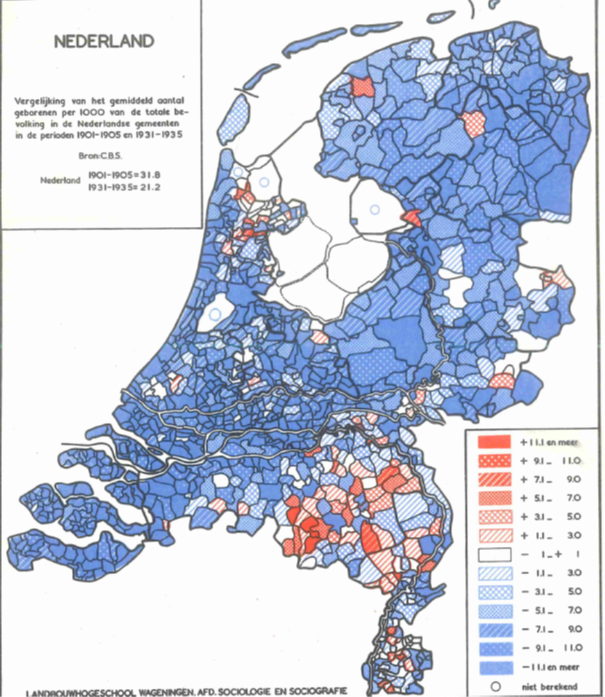
In the third map he looked at the first quarter of the twentieth century and compared 1931-1935 with 1901-1905. The Dutch crude birth rate declined even further from 1931-1935 to 1901-1905 from 31.8 to 21.2 birth per 1000 of the population demonstrating that the process of family planning was accelerating and spreading. The map coloured almost completely dark blue, accept (mostly) for North-Brabant.
Now we can return to the fourth map (with which we started). Here one can say that he compared the second quarter of the twentieth century. Remarkably the crude birth rate did not change between 1956-1959 and 1931-1935. However, it had changed between these periods.
| Period | Mean crude birth rate |
| 1931-1935 | 21.2 |
| 1936-1940 | 20.4 |
| 1941-1945 | 22.2 |
| 1946-1950 | 26.0 |
| 1951-1955 | 21.9 |
| 1956-1959 | 21.2 |
Source: Hofstee 1962, 15.
But more importantly, from the fact that the South now coloured blue we can see that after the Second World War the process of family planning/family limitation had reached the South too. Thus, the map should be read as a point in a process and not as just a comparison between two periods.
As said, Hofstee interpreted this process of fertility decline as a process of modernization. More and more families were prepared to practice modern family planning, demonstrating openness for change. Other sociologists, most well-known F. van Heek, interpreted the process as a process of secularization and differences between religions.
This discussion has been more or less settled with an article titled Demographic transition in the Netherlands. A statistical analysis of regional differences in the level and development of the birth rate and of fertility (1850-1890) by Onno Boonstra and Ad van der Woude (1984) from the Rural history group. They applied new and sophisticated statistical techniques to the data and concluded that although with regard to the level of fertility religion was the most important variable, this was not true for the development over time. Thus, one could say that they corroborated Hofstee’s interpretation, although he had not that strongly distinguished between level and development. Moreover, to explain the process of family planning/family limitation historians and other social scientists use the WAR-model by Lesthaeghe and Wilson. This is a combination of Willingness (desirability of family limitation increases when there is a decrease in family and labour intensive production with a flow of income from children to parents); Availability (availability of family limitation has never been a problem, although it has become better in time); and Readiness (are there cultural obstacles for practicing family limitation) (Lesthaeghe and Wilson 2017; Engelen 2009).
Literature
Hofstee, E.W. (1962). De groei van de Nederlandse bevolking. In A. N. J. den Hollander (Ed.), Drift en koers: een halve eeuw sociale verandering in Nederland (2e dr. ed., pp. 13-85). Assen: Van Gorcum.
Boonstra, Onno W. A., & van der Woude, Ad M. (1984). Demographic transition in the Netherlands. A statistical analysis of regional differences in the level and development of the birth rate and of fertility. AAG Bijdragen (24), 1-57.
Lesthaeghe, R., & Wilson, C. (2017). Modes of production, secularization, and the pace of the fertility decline in Western Europe, 1870-1930 The Decline of Fertility in Europe (pp. 261-292): Princeton University Press.
Engelen, Theo. (2009). Van 2 naar 16 miljoen mensen. Demografie van Nederland, 1800 – nu. Amsterdam: Boom.
[i] 75th Anniversary: 6) The Cartophoot: Hofstee’s geographic mapping of difference. https://ruralsociologywageningen.nl/2020/11/02/75th-anniversary-6-the-cartophoot-hofstees-geographic-mapping-of-difference/
